
Recently, one of our customers shared an interesting workflow that we thought might be useful for others.
They manage every project on a separate monday.com board. Each board stores live project information such as planned hours, allocated specialists, project budget, actual expenses, and customer details.
Meanwhile, their finance team maintains an Excel file with customer-specific billing rates and discount agreements. To calculate the final project budget and profitability, they needed to combine live data from all project boards with those financial parameters - without exporting everything manually whenever project data changed.
Here's how they solved it with Smart Spreadsheet:
Add Smart Spreadsheet as a Dashboard widget. Not familiar with monday.com Dashboards? Start with our overview guide.
Go to File → Import board and import the required boards (with or without subitems, depending on your use case). The imported data stays live and synchronizes both ways with the original boards.
Go to File → Import and upload your Excel (.xlsx) or CSV file containing the lookup data.
Reference imported sheets in formulas just like in Excel - for example, =Sheet_name!A1.
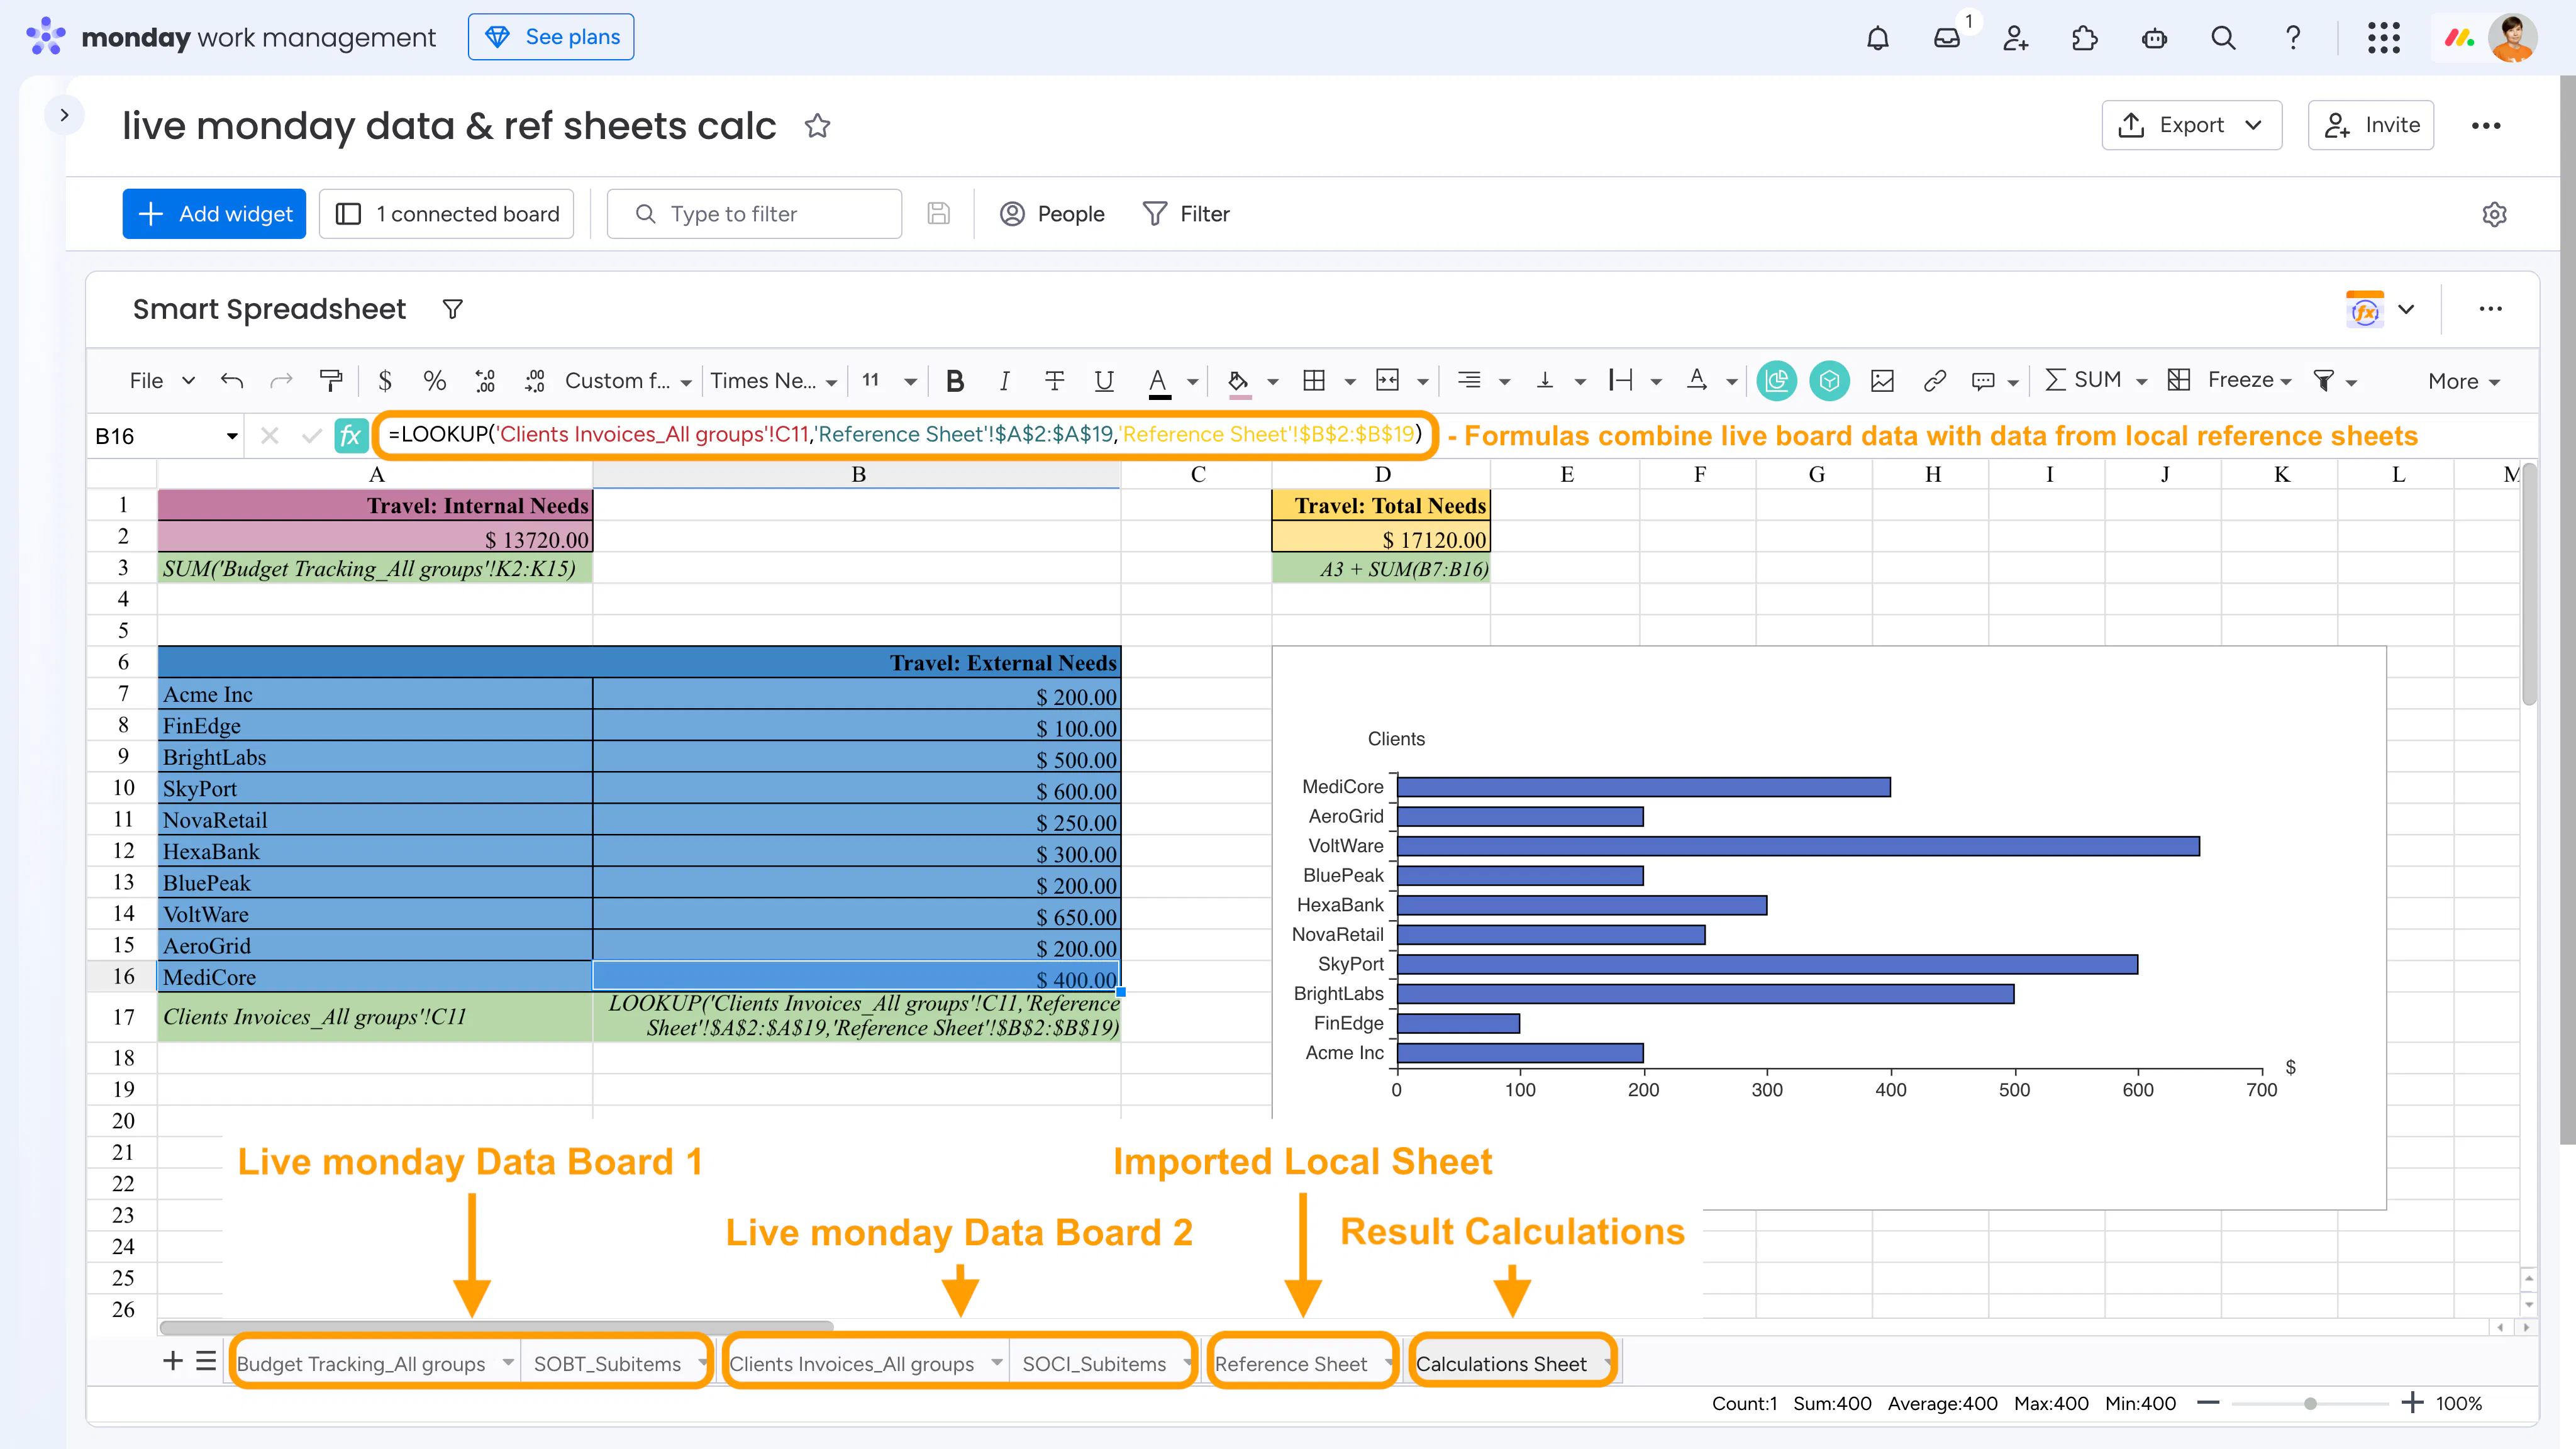
Now you can combine live monday.com data from multiple boards with imported lookup data to calculate project budgets, customer-specific costs, profitability, forecasts, or any other business metrics - all in one spreadsheet.
As the projects are updated, the spreadsheet recalculates automatically - no exports or manual data consolidation required.
💡 If you only need a few values from another board, you don't have to import the entire board. The ITEMVALUE() formula retrieves live values from any item or subitem across your monday.com account, making it perfect for lightweight cross-board calculations.
Have you built similar reporting or calculation workflows in monday.com? We'd love to hear about your use cases and discuss possible solutions.