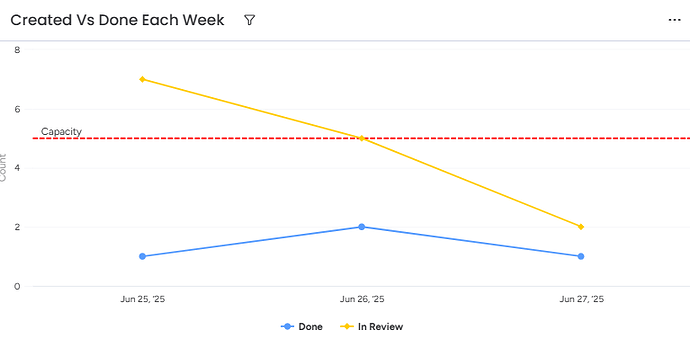
I think the Workload chart is useful but sometimes hard to read, adding in stacked bar charts and stacked line charts that work off timeline columns and could be grouped by status could really help to identify which weeks had too many tasks assigned, which ones were started that week vs which completed vs which not started at all. This could help identify the capacity of the team in absolute values, the weeks when there were too many tasks assigned and also when the team worked hardest to complete these tasks
Hi Rebecca,
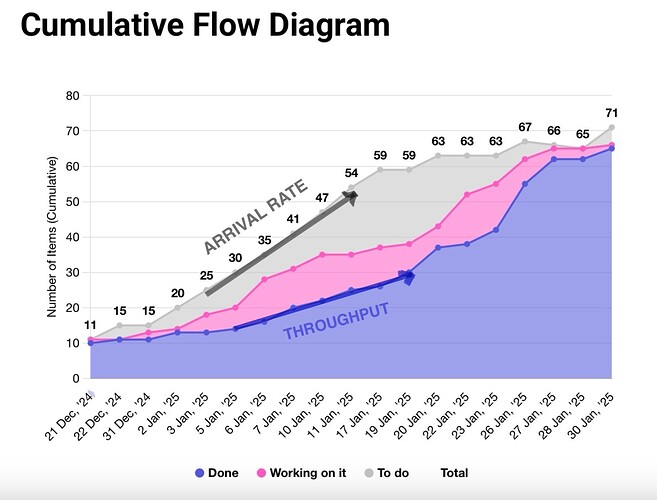
What you’re describing sounds like a great use case for a Cumulative Flow Diagram (CFD) and a Lead Time Histogram. These charts help visualize work by status over time, identify bottlenecks, and understand team capacity and task completion patterns.
I’ve developed a free app that provides both, and it might be exactly what you’re looking for. here you have an example:
Feel free to reach out at flusss.net — I would be happy to help!
Regards,
Kevin
That’s a fantastic idea! You’re right, the current Workload chart can sometimes be a bit tricky to interpret at a glance, especially when trying to understand the nuances of task progression. Adding stacked bar charts and stacked line charts based on timeline columns and grouped by status would significantly enhance its utility.

