I’ve been playing around with making advanced reporting and analysis possible using SQL, right in monday. It’s mostly been a pet project thus far, but it has potential for enterprises that employ business analysts, or if you’re tech-savvy.
SQL would enable you to query almost any insight from monday boards:
Create complex reports beyond the built-in filters and formulas
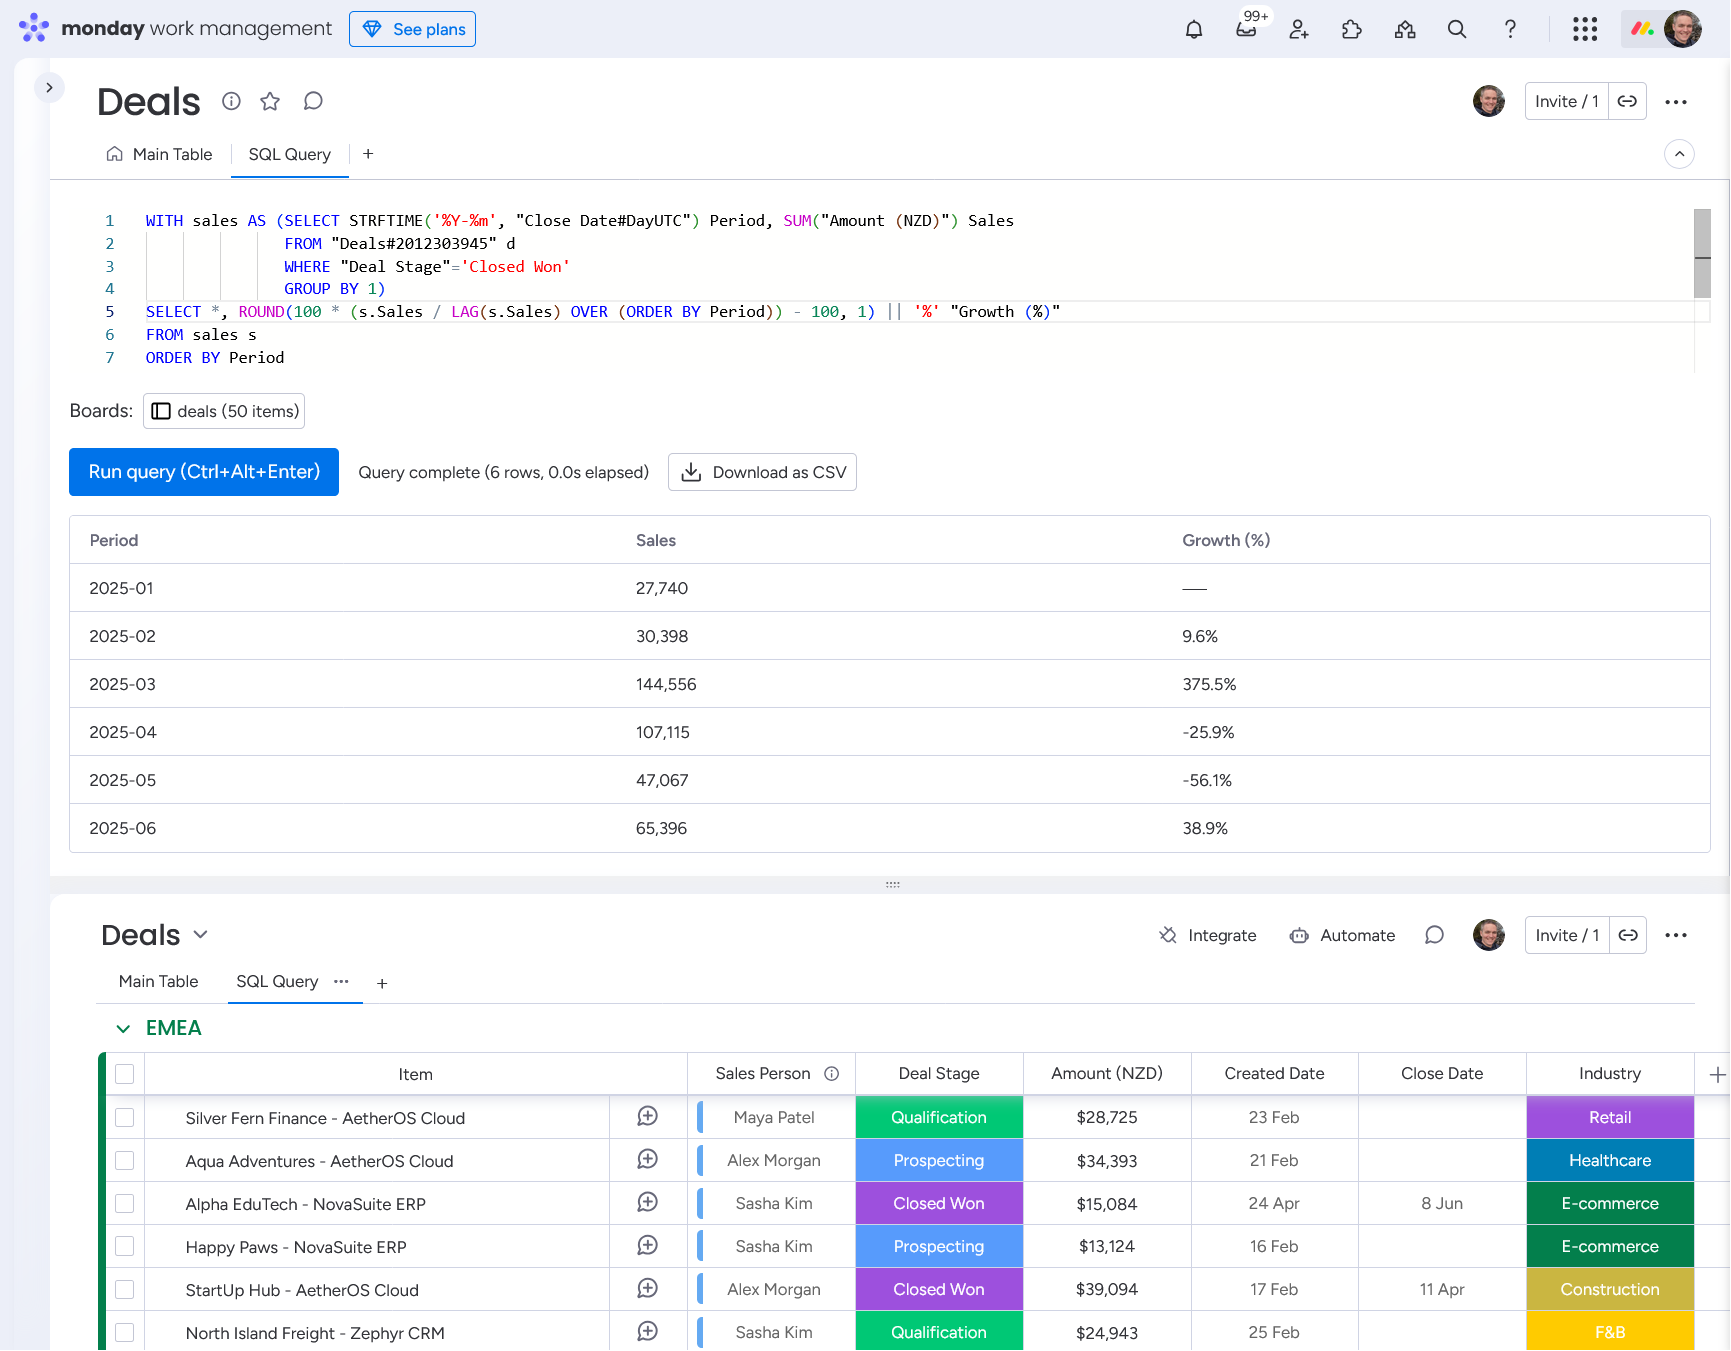
Perform historical trend analyses
Combine data across multiple boards, teams, and departments
Custom roll-ups across multiple groups using sum, average, min, max, count, histograms, quantiles, percentiles, median, mode, standard deviation, the list goes on.
The data could be viewed in board view, dashboard, used for charts, or be written to an actual board. Had my fun thus far, would take it further if people are keen. What do you need this for?
This is the ultimate game changer. One of the issues around the PMS tools is lack of room for making changes to data. Applying formulas and attaining various columns for a single value. This sorts that the complexity around making dashboards.
It’s not straightforward to build this. All the components for parsing the query, loading relevant boards using monday’s APIs, and running queries are readily available (to software engineers). It’s the putting it all together!
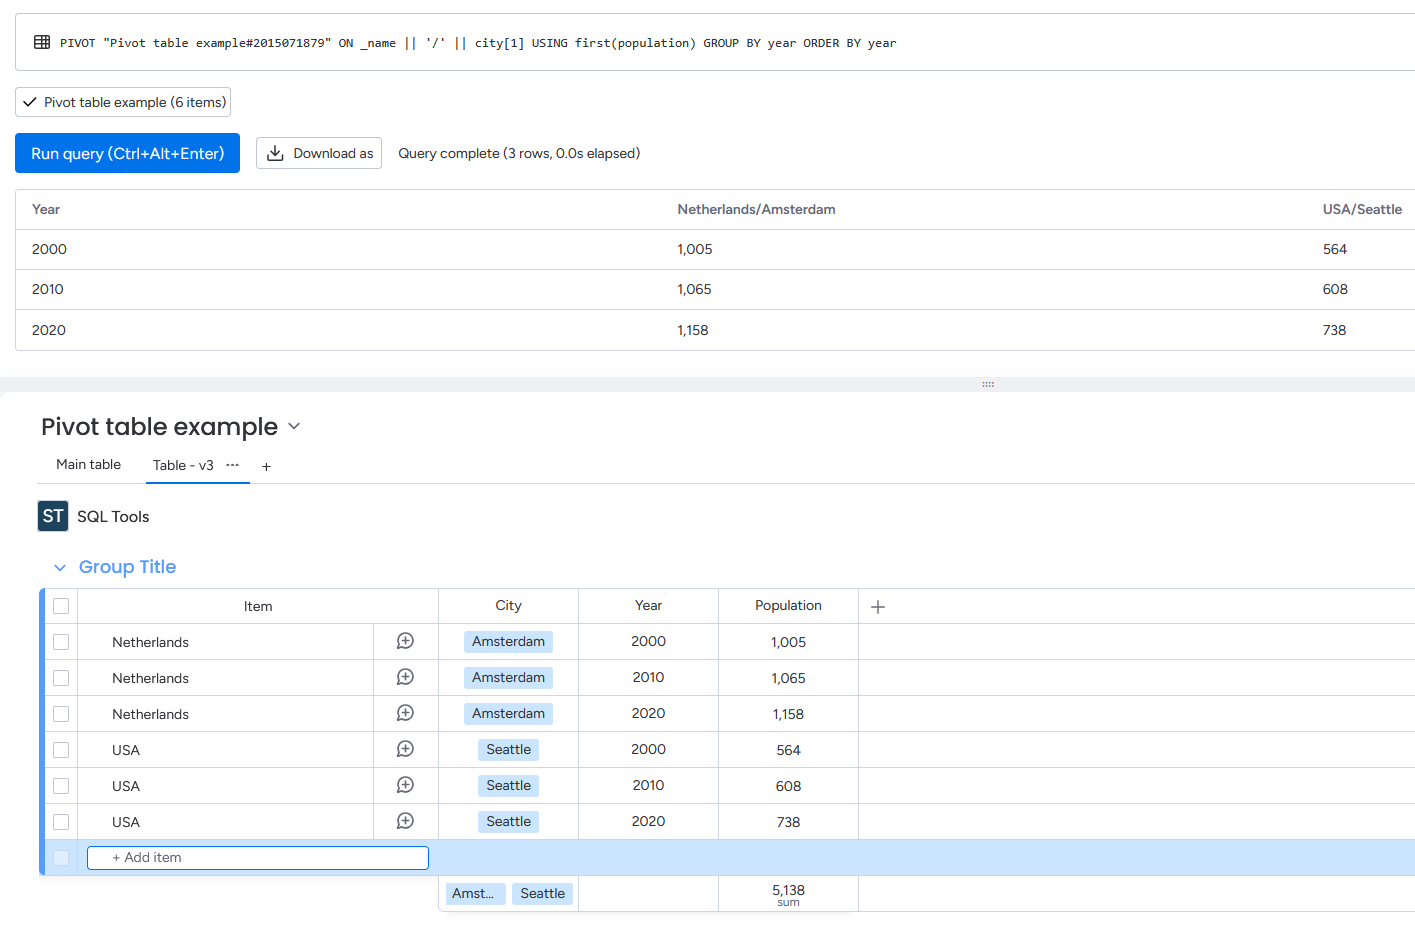
I was looking for a way to replicate a simple pivot table from Excel in monday, but so far have not been able to find a way to get even close. The pivot report available in the Enterprise plan is too basic, and I can say the same for one app I found in the Marketplace. This situation is forcing me to tell the users (who I am trying to convince to stop using Excel and use only monday), to export the data and build pivot tables in Excel.
If you can find a way through SQL queries to build a pivot table report, for me that would be very valuable.