Hi everyone, I am fairly new to Monday.com.
I am having an issue with charts. The figures are not shown as I have aligned the items in Main table.
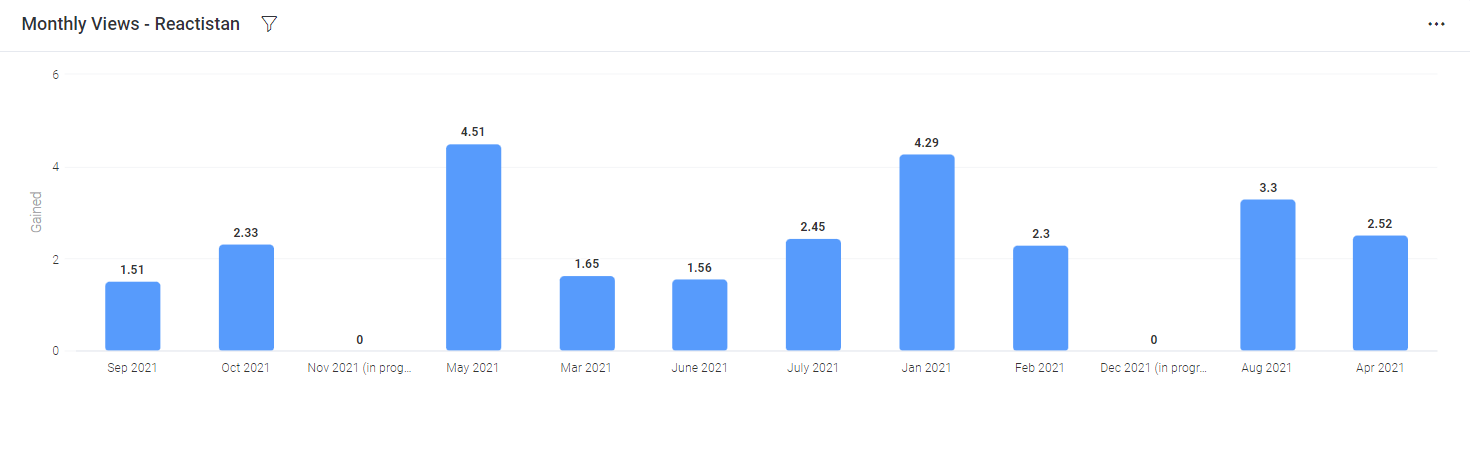
Chart:
Main Table:

Thank you!
Hi everyone, I am fairly new to Monday.com.
I am having an issue with charts. The figures are not shown as I have aligned the items in Main table.
Chart:
Thank you!
Hey @MediaVoice ,
quick walkthrough:
Create a “Date” column:

Set months:
Sort by Date:
There you go:
Greetings
Hi,
I am having the same issue. My main board looks like this:
2023 Budget LinkedCol Formula Col 2023 Actual 2022 2021 2020 2019
Revenues 10 500 200 100 50
Expenses -5 -100 -50 -20 -10
The Chart displays the Net Income (Revenues - Expenses) correctly.
However, the chart shows the years in a random order:
2023 Actual 2018 2023 Budget 2022 2017 2021 2020 2019
I don’t understand the recommendation to change my number columns to “date” columns. I need to input revenues and expenses…not dates


