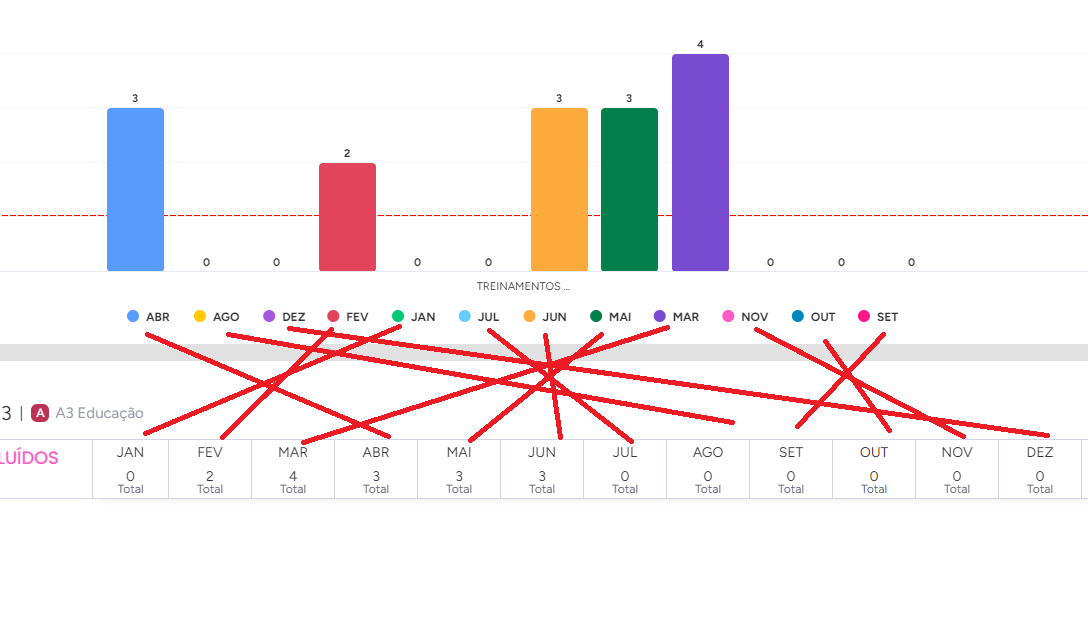
Hello. I’d like to suggest a way to classify the order of the data in the chart according to the order the items appear in the table. In this case (image 1), for example, there are months, but the chart sorts the visualization based only on values (increasing and decreasing), then I lose the sequence visualization in the graph, as it is in the table (image 2). It would be nice if the graph data could be sorted in the same order they appear in the table below.
(PS: it’s fictional data in the images, just for trial of the product)

I have the same question. Is there a way to view the chart by the actual months in order opposed to by value?
Yes! I’m struggling with this now. Would like to at least be able to sort by order of items in table, or even better, order x-axis (items) by a value or date in one of the columns on the date. For instance, I’d like to plot costs of projects over time, but I can only sort by ascending/decending cost values or in alphabetical or reverse alphabetical order of x axis (project names), not by item order or date.
1 Like
@JessicaWM this is a perfectly explained solution that would solve this in a simple way.
1 Like
Definitely need this one - especially when trying to look at data in a chronological way (eg. month by month, year to year)
I’m having the same problem. The only thing I could think of was added a number to the head of the text string in the column header. If you number the month headers sequentially then sorting would work.
Same issue here! But the other way around what columns and rows:

resulting in

Only possible to sort through Y axis or X axis.
This realy should be fixed asap, I see this thread has been open for more than a year.
Anyone found a temporarily workaround?
I added “count” to the occasion which helped, but looks silly in the graph…

