I have 6 months data and I want my line to stop there. Instead it shows a horizontal line where I don’t have data.
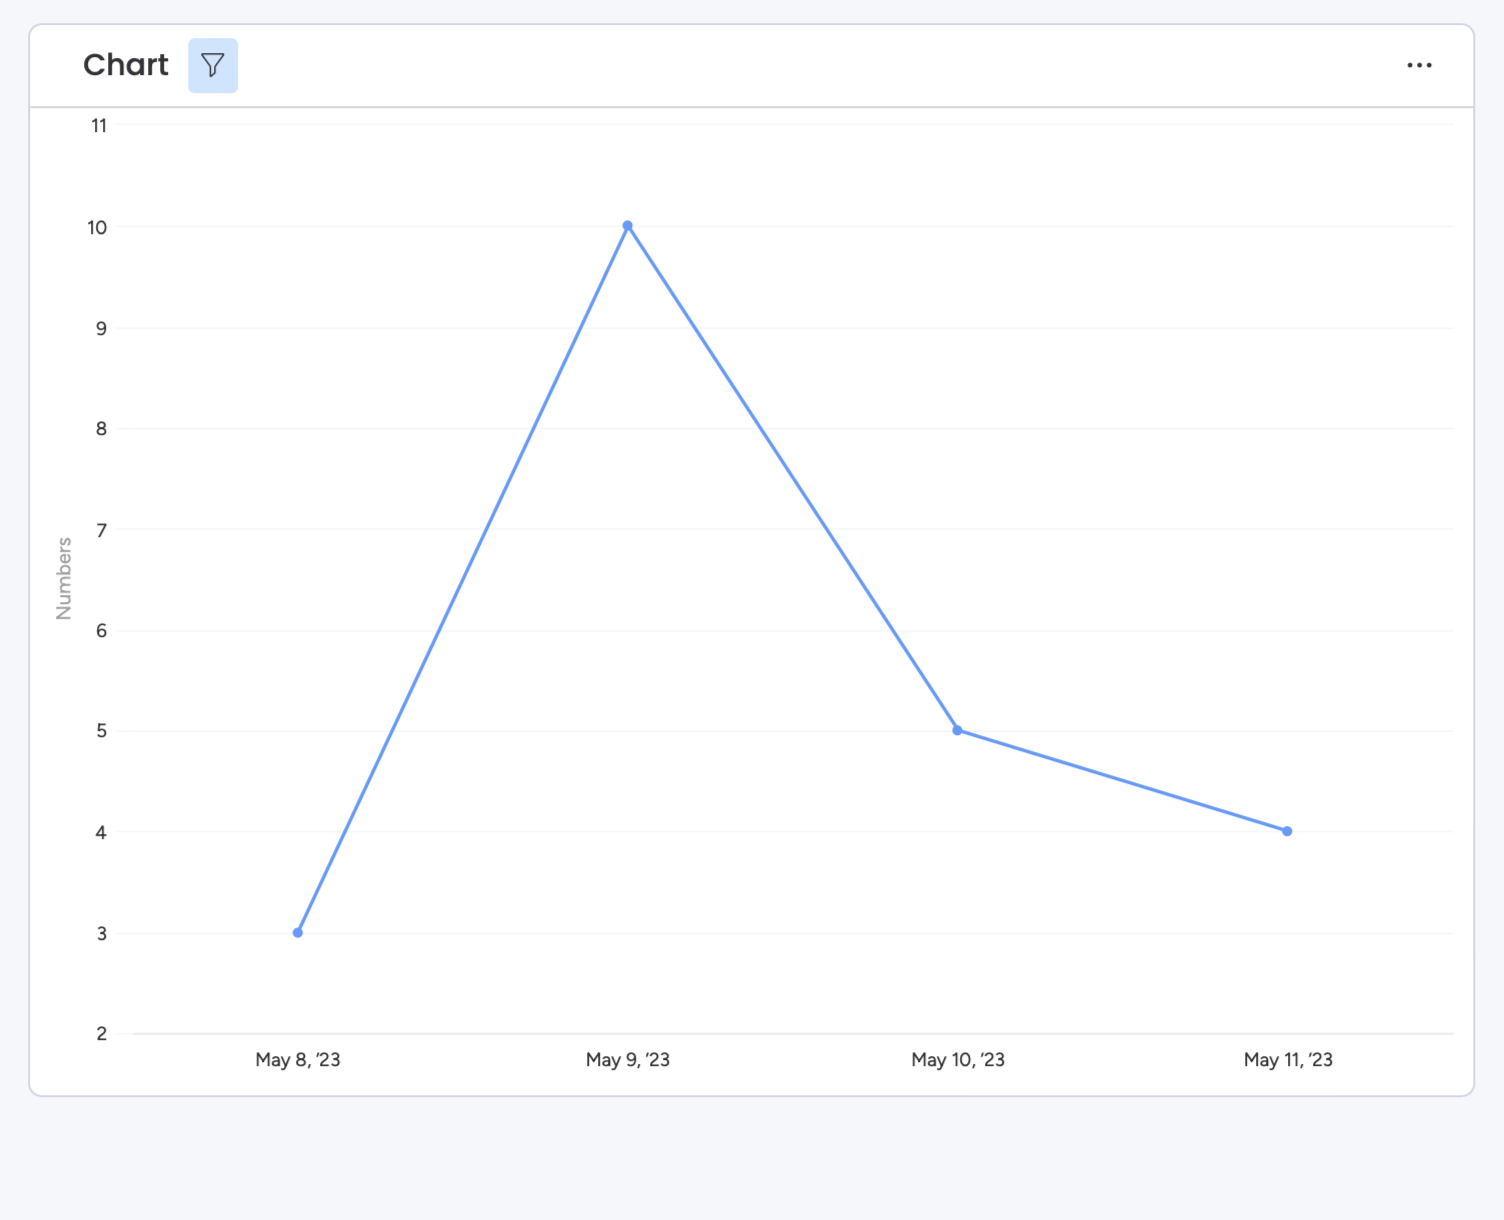
You should use filters. In your chart widget, you can filter either for that time period, or you can filter based on that column and only show entries where that data exists for example. Here’s a basic example, showing before, after, and filter.