I have an issue with filtering a dashboard by last X months - it is not filtering by complete months.
Here is some sample data:
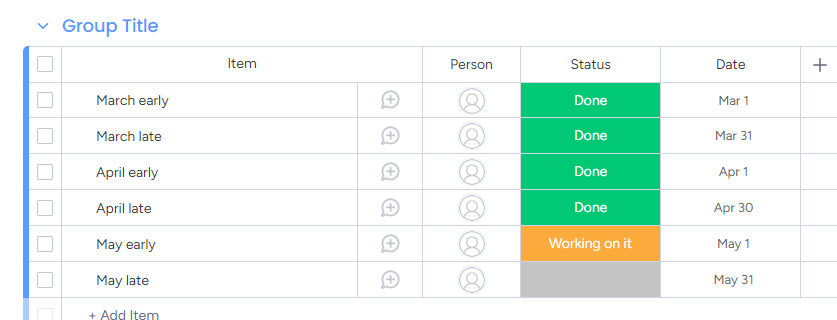
Here is the chart without a filter:
If I apply the filter “last month” I get this result, which is expected behaviour:
If I apply the filter “last two months” I get this result, which is not what I expected:
I believe this is showing the last 60 days, not the last two months, which I consider to be different.
I think I disagree.
If something is in the last 1 month, I’d expect everything from that day of the last month. Let’s say it’s June 5th and I have “in the last month”, I expect everything from May 5th. I wouldn’t expect June 1st - June 5th.
What you’re looking for could be achieved fairly easily via a formula. If you have a specific requirement, I’d be happy to create that formula for you.
EDIT:
Decided to make it. There may be an easier way but this will work. It’s just a generic month difference formula. You can filter it in any way you require.
MONTH(TODAY())-MONTH({Due Date})
+
12*
(YEAR(TODAY())-YEAR({Due Date}))
Thanks for the reply Francis. I still think that, for a chart that shows monthly activity, each month should show everything in that month.
As a compromise, like you, I opted to calculate a month “offset”, which allows for dynamic manipulation:
(12*YEAR({Date}) + MONTH({Date}))
-
(12*YEAR(NOW()) + MONTH(NOW()))
This gives me this view:
Which I can then filter (previous two months plus current month):
To give me the desired result:
Looks to have worked! Best of luck, Gareth.