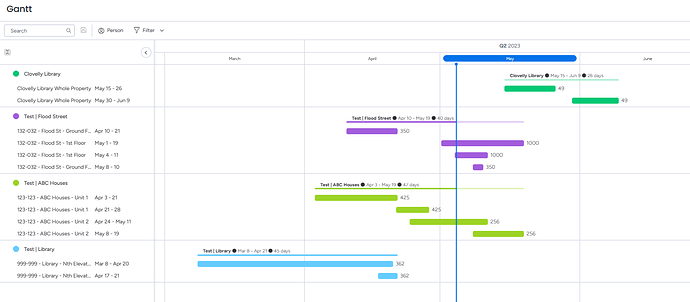
Hi, does anyone know if it’s possible to edit the row labels on the Gannt and Timeline Charts? - You’re able to select multiple columns to add to the view, but it doesn’t seem to label them so you know which is which.
I have a list of work packages ( 1 row per work package). Each WP has 2 schedule columns for the 2 phases we use (let’s call them PhaseA and PhaseB). When I put in a gantt there’s no way to differentiate between the two schedules. This causes issue because A) you can’t tell which phase is happening when and B) you can’t look vertically to compare PhaseAs and PhaseBs across projects.
Anyone know of a solution/workaround? - I need to keep the data for a WP on a single row in the actual table.
In the example I’ve posted, I have grouped by Project (ie Flood St), with the WPs being Flood St Ground, Flood St 1st Floor etc. The two phases are split into 2 rows, but it doesn’t say which is which either on the label or the left hand columns.
