Hi! I built a ticketing system somewhat based upon Monday’s IT ticketing template (which is great). I am using the timer function as a column to track the length of time a ticket is open. I also have date opened and date closed columns. I would like to figure out how to do a chart or other analytic that will show the average length of time it takes to close tickets.
I set up automations that automatically add the ticket created date, the date and time closed, and to turn on/off the timer.
Perhaps other Community members have a better idea of how to do this (based on their own use cases), but my first thought is that you might want to manually enter the time into a Numbers Column after the timer is stopped.
Then, in a Dashboard you can use a Numbers Widget and then in the settings of that widget, select to calculate the “average” of all the Number Columns selected. This should show you an average of all the time tracking sessions then.
Thanks for the idea. If there is a way to automate that, I’d be on board. I want to steer clear of having to do things manually. I’ve already automated most of it. If I want to do things manually - then I’d be using Excel! LOL I appreciate it, though.
You’re having trouble because the automations can’t see the time tracking column. Not even Column Magic can see this one. Given you can establish that you can’t get an automated average to calculate based on your time tracking column, if that’s still your end goal it can be achieved - you would need to look at a different integration, something like Clockify or Harvest.
You can use automations to set things up between platforms, bring the ticket time back in to your board as a useable column and you’ll be able to automate your average.
If you are in fact using the time tracking column and have the automations set up, you can simply add a formula column within the board to structure the time spent into which ever form you would like (this example is in decimal hours). Add the formula:
DIVIDE({Time Tracking#Minutes},60)
This will show the hours like 1:30 in 1.5 hours.
Once you have this column, you can now do a few things to get the average:
Group Average - click on the total field under the group, then select average rather than sum on the formula column.
Number Widget - on your dashboard, you can select the formula column in the settings and then set it to show average.
Graph Widget - you can select the completion date as X axis and show by month, then select the formula column of Time to Close for the y axis. Set the y axis to show average.
Those are good options to start with. If you are looking for more assistance let me know!
Hey Mike, all of your solutions are really great - thank you SO much. Going to use all three options and see what works best. I really appreciate your response and expertise!
Hi Mary,
Did you eventually find a good way of doing this?
I’m trying to achieve something similar, with already-existing tickets that don’t have a timer in place, so ideally, I’d want to be able to apply it on the old tickets. But I guess there’s some formula for filling in such a column retroactively?
Thank you
Hi, Uri-Lev, I did not really try this for retroactive tickets, so I can’t help you there. The timer itself is really great, and i was able to turn it on automatically when I put in a ticket.
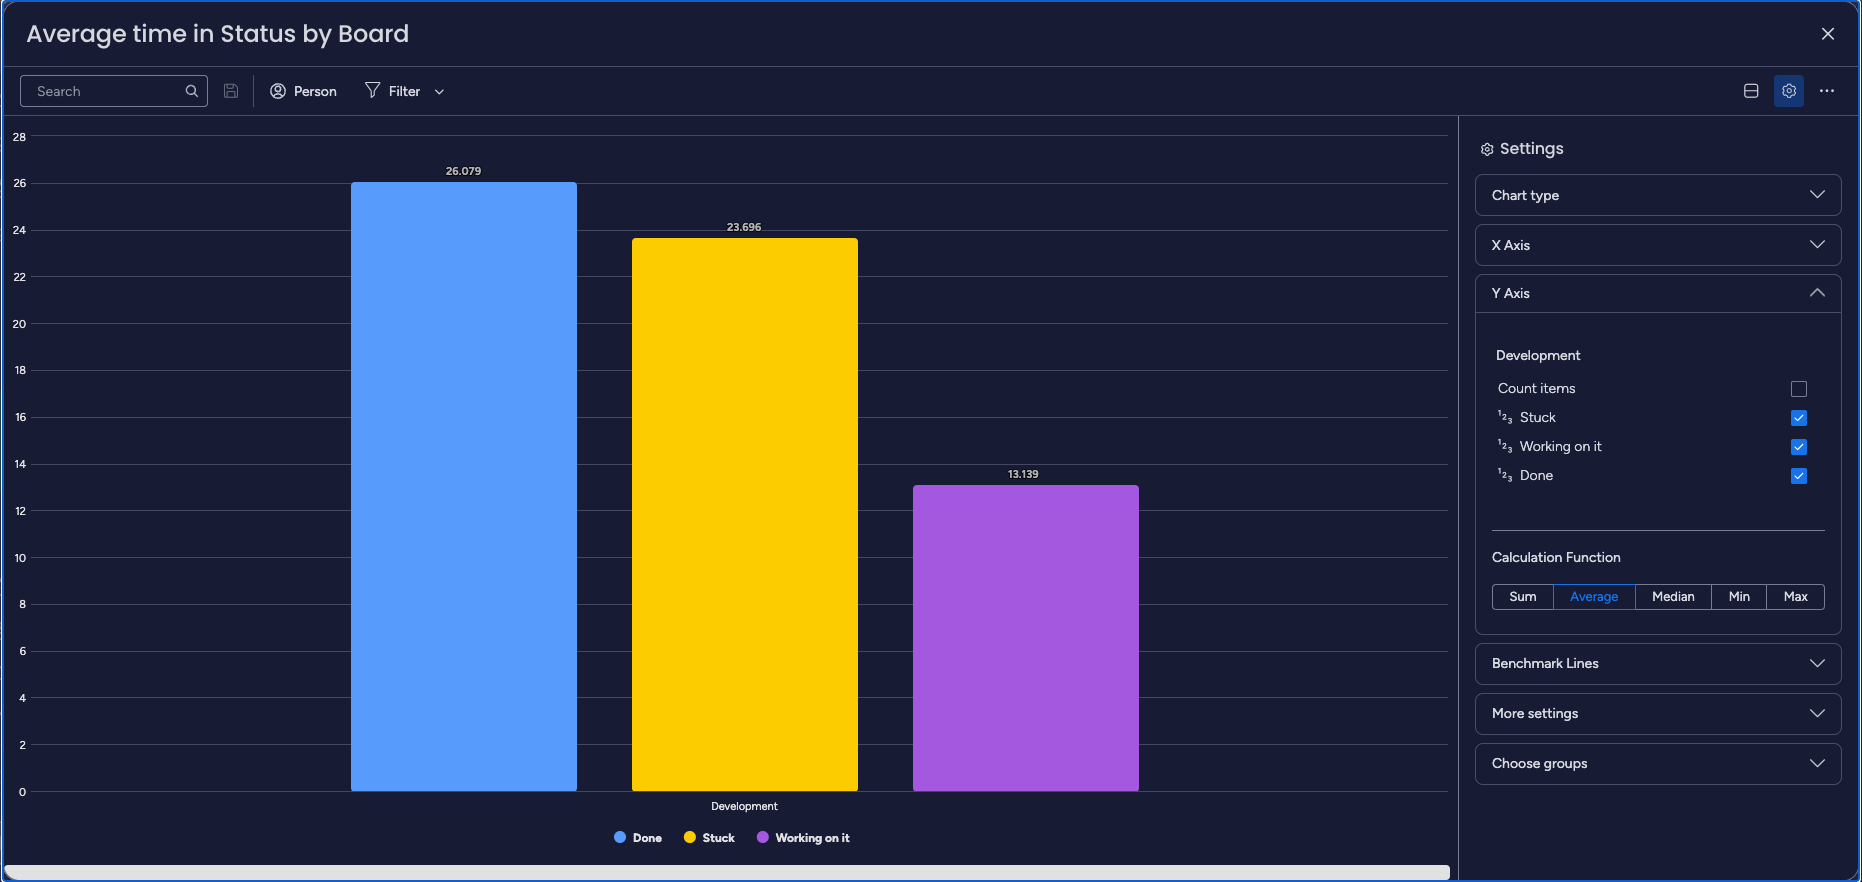
The Average Time in Status feature allows you to track and analyze the average time spent in different statuses for each board or project in your workflow. By activating the Time in Status app on your board and utilizing the chart gadget on the dashboard, you can easily visualize and summarize the average time spent in statuses for different boards. This feature helps you monitor board performance, identify bottlenecks, and optimize overall team efficiency based on the average time taken to complete tasks in different statuses.
Identify boards with longer or shorter average times in specific statuses, allowing you to analyze workflow efficiency and identify areas for improvement.
Use this information to ioptimize processes, allocate resources effectively, and make data-driven decisions to enhance team efficiency.