Tracking how your work progresses over time is essential for understanding project dynamics, spotting slowdowns, and forecasting future trends. While monday.com reporting tracks current status, you may need a deeper visibility into workflow evolution—that’s where eazyBI comes in.
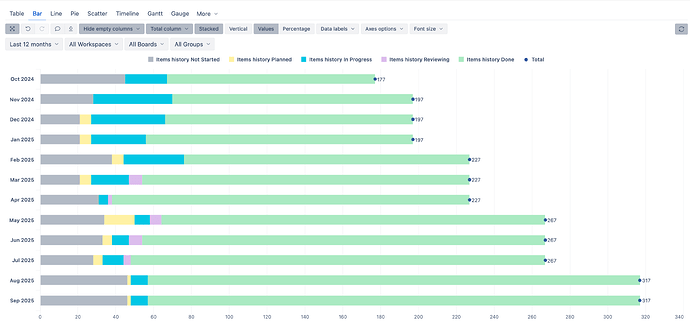
One of our favorite examples is the “Items History Over Time” report, which visualizes how items have moved through different workflow statuses over the past 12 months. Here’s what it offers and why it’s a game-changer.
The visualization consists of stacked bar chart with:
-
Time dimension across the past 12 months
-
Transition Status dimension - Not Started, Planned, In Progress, Reviewing, Done.
-
Measure:
- Items history – counts items at the end of the selected Time dimension period in the selected Transition Statuses
By applying report filters, you can customize the report for specific workspaces, boards, creators, users or any other dimension for the time period of your choice.
 Hero Spotlight: Items history
This custom measure aggregates transitions to and from each status — showing not just what’s happening now, but what happened then. It provides a true historical flow of your work—not just static snapshots.
Or, in other words:
![]() “Show me what the board looked like at each moment in time.”
“Show me what the board looked like at each moment in time.”
This is super useful for monday.com users because monday.com doesn’t keep full historical snapshots of item statuses. With this custom measure, eazyBI rebuilds the status history from available change logs. You can finally answer:
-
“How many items were actively being worked on in February?”
-
“Was March the month when things were mostly Done?”
-
"Are we speeding up over time, or getting stuck in ‘In Progress’?
Wrap-up:
This report is like a time machine that shows you what your board really looked like over time — not just what it looks like today. Perfect for project owners who want deeper insight into project health, progress flow, and bottlenecks — without needing complex setup.
-
Spot trends — Are more tasks getting stuck in “Planned” than before?
-
Monitor team activity — Is your team completing more work this quarter?
-
Celebrate progress — That huge green “Done” bar in April?
 High five!
 -
Support retrospectives — Bring this to your next planning session or sprint retro
Want to find out which boards, groups, or workspaces had no items with status changes in the previous week? Or maybe you want to find out how many days the item was or is stuck in a certain status? Reach out to the eazyBI support team — we’ll help you build the report!
